Padel stats explained: winners, errors, rally length and more
Updated 23 October 2026
The padel statistics that tell a club player the most are how each point ended, winners and errors per player, rally length, the mix of shots, and where you stood when you hit. Read them against your own last few matches, not against professionals, and ignore any number built on only a handful of points.
How points end
Every point ends one of a few ways, and counting them is the most useful single statistic in padel. In Padelapu a point ends with a winner (the ball could not be returned), in the net, out or wide, off the glass, or other.
- Winners are points you or your partner won outright.
- Errors are points you ended by missing: net, out or glass.
- Winners minus errors is a quick health check. Club matches are mostly decided by errors, not winners, so a pair that halves its errors usually wins more than a pair that hits more winners.
Rally length
Rally length is the number of hits in a point, both pairs counted. The average and longest rallies show a match's style. Short rallies often reflect points decided by serves, returns and early errors. Long rallies can reflect patient point construction and fewer early errors.
If your average rally is short and you lose most short points, look at your serve and return. If you win the short points and lose the long ones, you are probably giving up the net too easily.
Shot mix
The shot mix is the share of your hits that were serves, drives (after the bounce), volleys (before the bounce) and lobs. Overheads, the bandeja, vibora and smash, are high contacts above the head.
- A high share of volleys means you spent a lot of the match at the net, which is where padel points are usually won.
- Few lobs often means you rarely got the opponents off the net. The lob is padel's main way to take it back.
- Review what happens after your overheads. Review the errors on video. Would a controlled bandeja have helped you keep the net?
Where you stand
Position statistics split the court into the zone near the net, the back of the court and the transition zone between them. They show what share of your hits came from each zone, and heatmaps show where on court you spent the match.
The zone to watch is transition. A lot of hits from there, especially errors, usually means stopping halfway to the net instead of going all the way or staying back.
In Padelapu, the three zones come from your tags. The automatic analysis tells only front from back, so on automatic data the net counts as transition.
How far apart you are
Pair spacing is the distance between you and your partner during a rally, and whether you are level (both at the net or both back) or split (one up, one back). Level pairs leave fewer gaps. Padelapu Pro's tactical replay reads it from the video for every rally and shows it from above.
Compare with yourself, not with one match
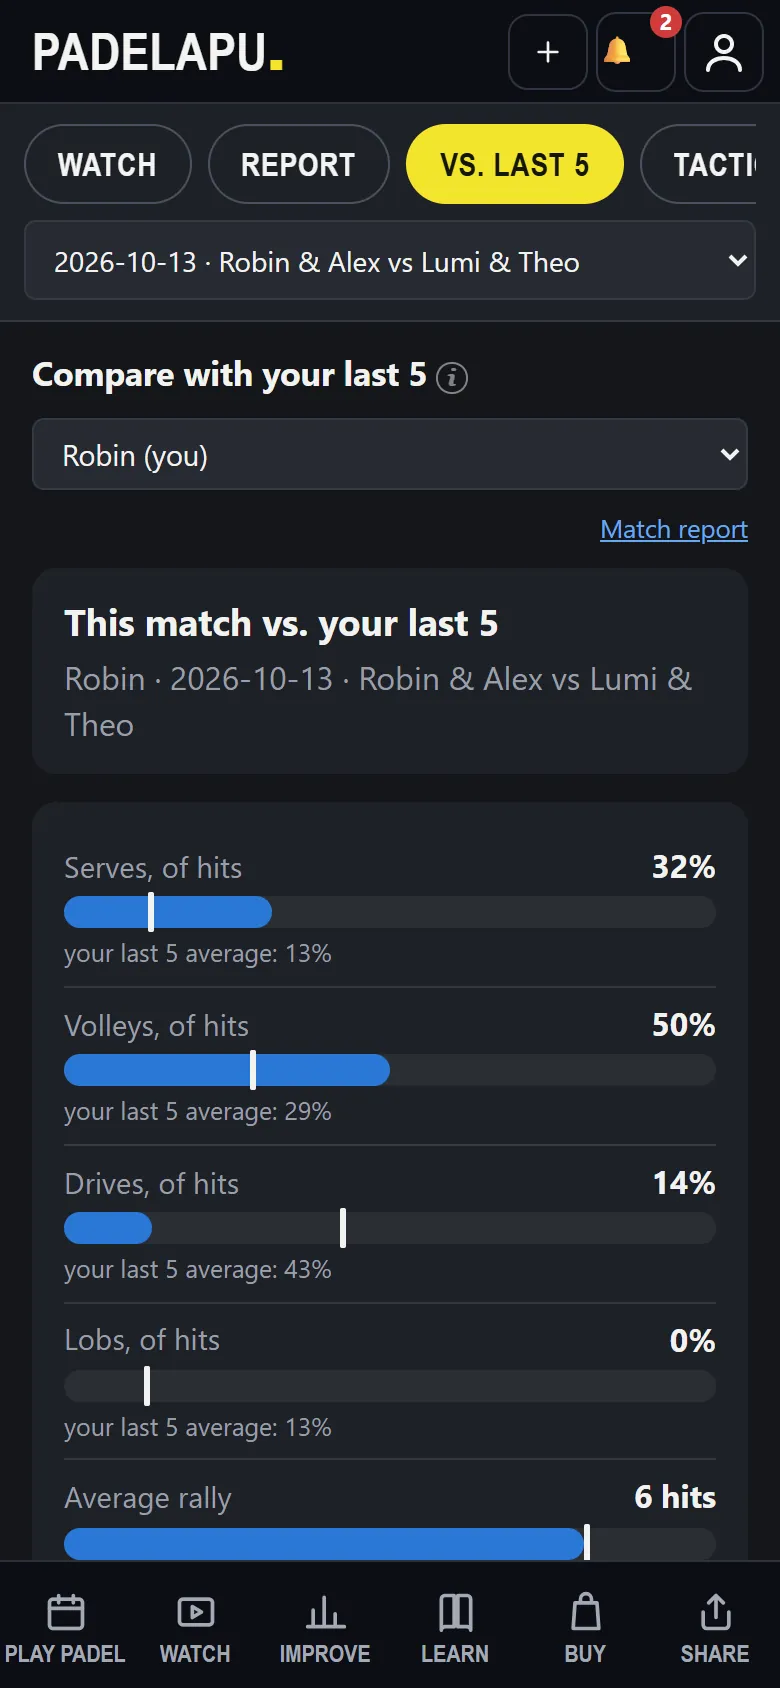
One match is noisy: a strong pair across the net or a windy day changes everything. The comparison that means something is this match against your own recent average.
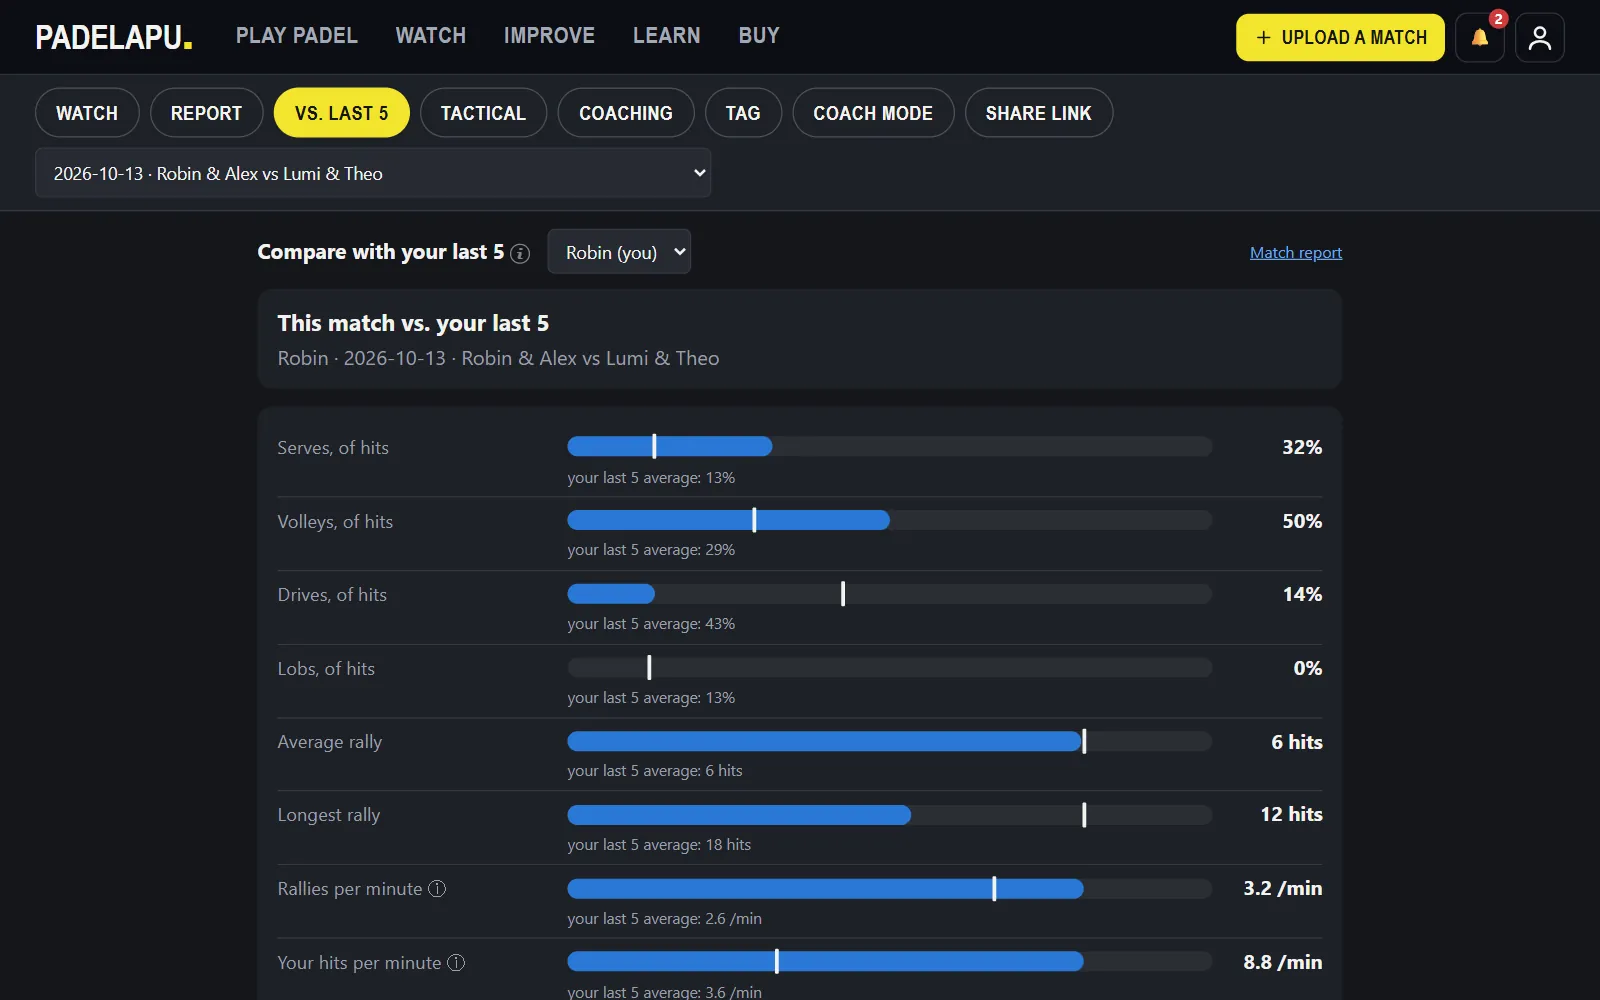
Pace numbers, rallies per minute and hits per minute, belong in the same comparison. They depend on how long the breaks between points are, so compare them across your own matches, not between different groups.
When to trust a number
A percentage built on four lobs is an anecdote. Always look at the count behind a statistic, written n. Padelapu shows it next to its numbers, and its coaching page compares a match with your others on a habit only once both have enough cases.
Where the numbers come from matters too. Numbers from Padelapu Pro's automatic analysis are read from the video. Numbers from your own tags are labelled as tagged.
Reading a match report
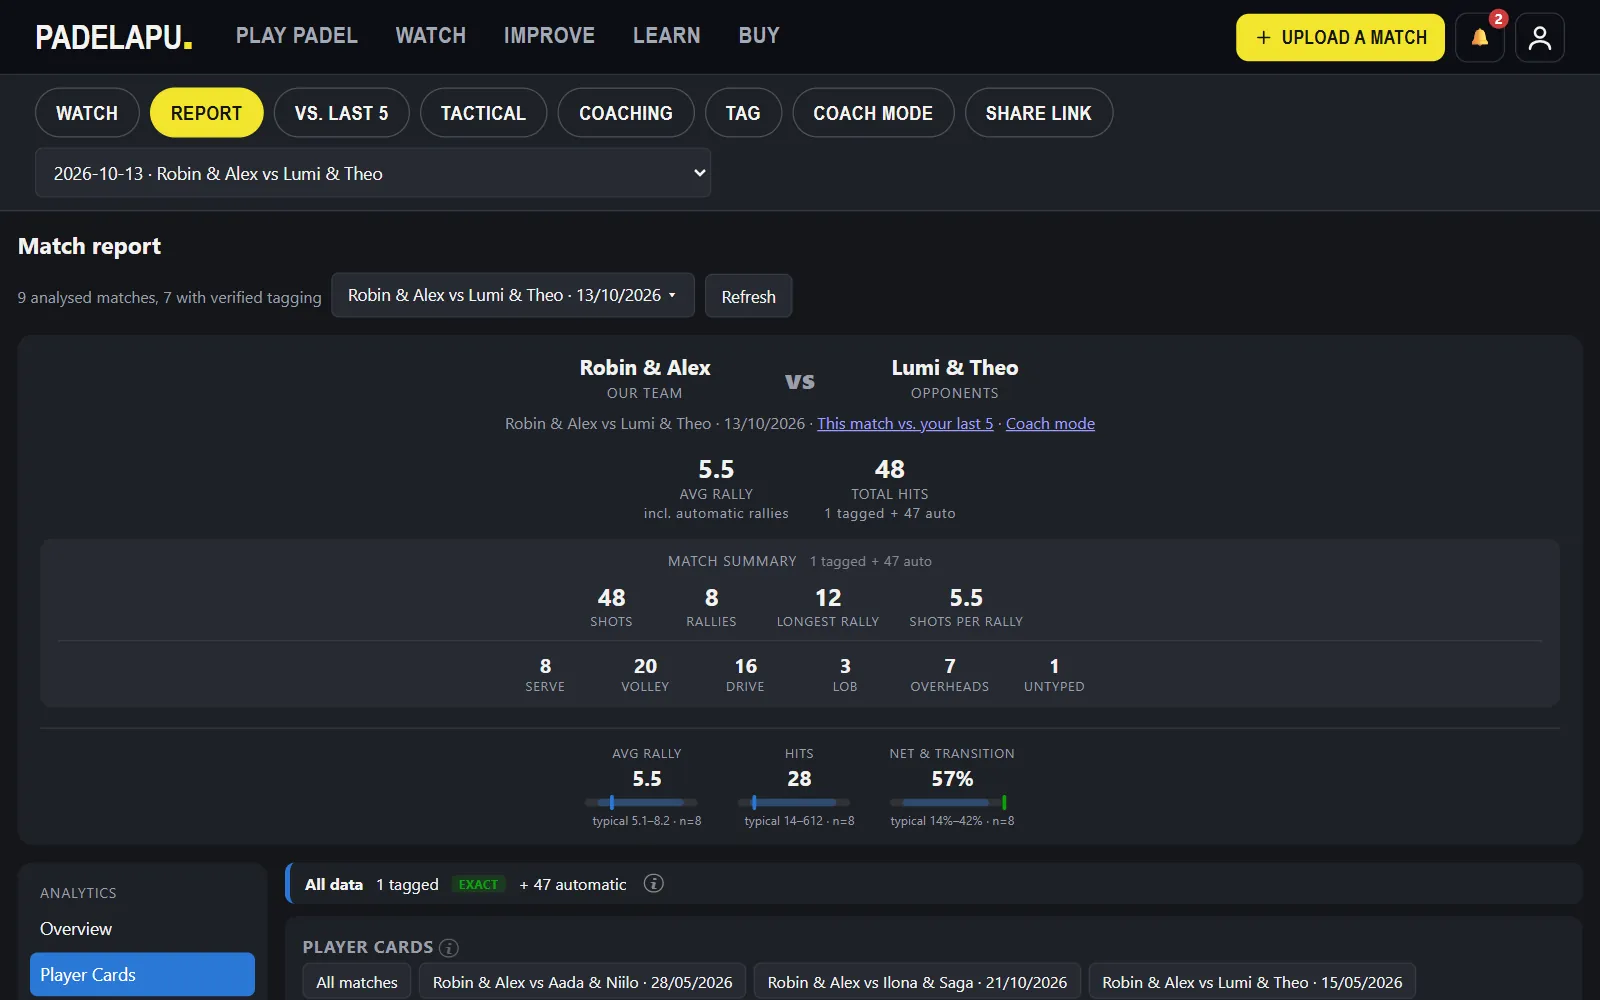
Start at the top: points won and lost, and how they ended. Then open your own player card and look for the one number that stands out against your usual. That is the question to take back to the video: find the points behind it and watch them, as the video analysis guide describes.
Questions
What is a good winner-to-error ratio in padel?
There is no fixed number for club players; it depends on the level and on the opponents. Track your own ratio across matches and aim to move it in the right direction.
How do I get these stats for my matches?
Film the match, upload it to Padelapu and tag each hit and how each point ended; the stats and reports build from your tags, free. With Pro, the automatic analysis reads rally length, shot mix, pace and front or back positions from the video for you; winners, errors and how points ended still come from your tags.
See your own numbers
Stats, heatmaps and reports from the hits you tag are free in Padelapu. No card needed.